Analysis Routine (IDL)
We support IDL code for analyzing the FISS data. If you want to use FISS code, please check your computer whether astron package is installed or not. We highly recomend to install the Solar Soft. You can download the FISS codes from here. For analyzing the FISS data, you can study just three procedures/functions, fiss_read_frame, fiss_show_sp and fiss_raster.
If you want to read 20th frame from FISS 3D data and FITs header, you can use fiss_read_frame function as: If you want to make raster scan images with 5 wavelengths which have specific bandpass from blue wing to red wing, you can use this fuction as: In this process, sp_image have 5 different images with range of 0.03Å. This procedure shows not only raster scan image(s) with different wavelengths but also a spectrum profile at specific position. By using cursor procedure, you can identify the position at raster scan images and line profiles at that position. If you want to show raster scan images and line profiles at specific position, you can use this procedure as: You can see two windows: 1. a series of raster scan, 2. a line profile and a spectrogram at the position where mouse curser is. By clicking mouse cursor, you can check the position on raster scan image. Furthermore, you can also see the spectrogram and line profile at the position on raster scan image.fiss_read_frame
    function fiss_read_frame, file, x, h, pca=pca
    ;+
    ; Name: fiss_read_frame
    ;        read one frame (spectrogram) from a FISS file or its associated PCA file.
    ;
    ; Syntax: result = fiss_read_frame(file, x [, h], /pca)
    ;
    ; Returned values:
    ;        a spectogram
    ; Arguments:
    ;        file ---- name of file to be read (input)
    ;        x ---- the frame number (input)
    ;        h ---- fits header (optional output)
    ; Keywords:
    ;        pca if set, data are read from the associated PCA file (default is set )
    ; if not to be set, keyword sould be set to 0.
    ;
    ; Remarks:
    ;        For example, suppose a file is named as 'test_A1.fts'. Then the associated file
    ;        name should be 'test_A1_c.fts' in the same directory. This file contains the
    ;        coefficient of the PCA components. The PCA basis profiles are contained in another
    ;        file whose name should be specified in the FITS header of 'test_A1_c.fts', e.g., like
    ;        'test_A1_p.fts'. This file also should be in the same directory as 'test_A1.fts'.
    ;
    ; Required routines: fiss_read_pca_file, readfits_frame
    ;-
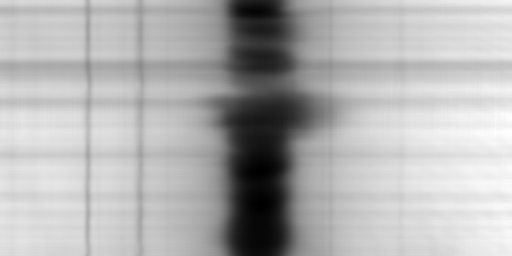
    IDL> sp1=fiss_read_frame(filename, 20, h)
    IDL> tvscl,sp1
fiss_raster
    function fiss_raster, file, wv1, hw1, pca=pca, pixel=pixel
    ;+
    ; Name: fiss_raster
    ;       Construct a set of raster images at different wavelengths
    ;       either from FITS file or PCA files
    ;
    ; Syntax: Result=fiss_raster( file, wv, hw, /pca, /pixel)
    ;
    ; Returned Values: A set of raster images constructed at the specified wavelength(s)
    ;
    ; Arguments:
    ;       file ---- name of FISS file to be read
    ;      	 wv ----	wavelength(s)
    ;      	 hw ---- half-width(s) for wavelength integration ; in uint of angstrom
    ; ; Keywords:
    ;       pca ---- if set, coefficients of principal components are used for
    ;       image construction (default is set).
    ;      	 pixel ---- if set, wavelengths and half-widths are in pixel units.
    ; Useful for data not calibrated for wavelength.
    ;
    ; Remarks: By default, wavelengths and half widths are in unit of angstrom, and wavelengths
    ;        are measured from the center of the reference line.;
    ;       if pixel keyword is set, wavelengths are measured in unit of pixels and
    ;       are measured from the first pixel in the row.
    ;
    ; Required routines: fiss_read_frame
    ;-
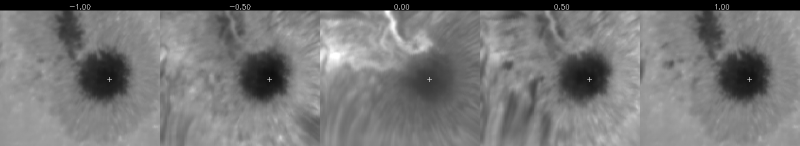
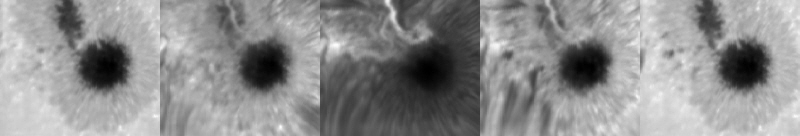
    IDL> sp_image=fiss_raster(filename, [-1.0, -0.5, 0., 0.5, 1.0], 0.03)
    IDL> for i=0, 4 do tvscl, sp_image(*,*,i),i
fiss_show_sp
    pro fiss_show_sp, datafile, wv, hw, x=x, y=y, pca=pca, scale=scale, raster_image=raster_image
    ;+
    ; Name: fiss_show_sp
    ;        interactively shows the profile and spectrogram when a position is selected
    ;        on the raster image that may be internally constructed
    ;
    ; Syntax: fiss_show_sp, datafile [, wv, hw], /pca, image=image
    ;
    ; Arguments:
    ;        datafile ---- the name of data file
    ;        wv ---- wavelengths of the raster image to be constructed
    ;        hw ---- half width(s) of the band used for the raster image construction (optional)
    ;
    ; Keywords:
    ;        pca ---- if set, data are read from the associated PCA-compressed file (set by default)
    ;
    ; scale ---- factor(s) to be multiplied to the standard deviation of image values
    ;        to construct byte-scaled images (default=4.)
    ;
    ; Remarks: 1) if arguments wv and hw are specified, keyword image is considered
    ;        to be output. if not, image is considered to be input.
    ;
    ;        2) Whenever left mouse button is pressed down, the spectrogram and profile
    ;        are drawn. When right button is pressed, the program finishes.
    ;
    ; Required routines: fiss_raster, fiss_read_frame
    ;-
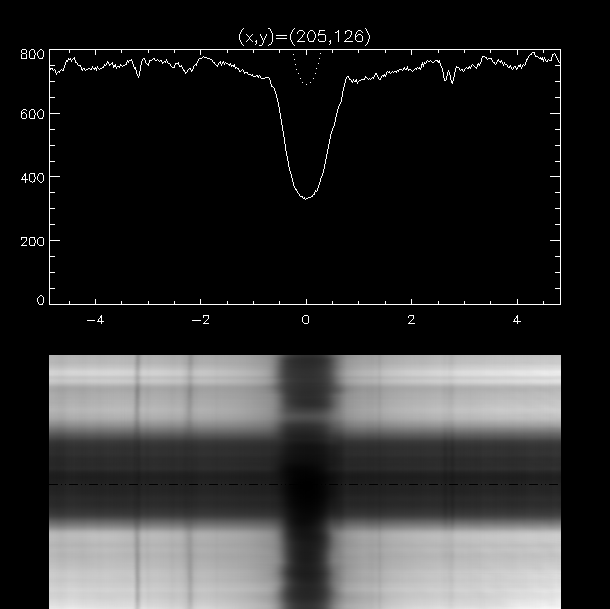
IDL> fiss_show_sp, filename, [-1.0, -0.5, 0., 0.5, 1.0], 0.03