Data Structure
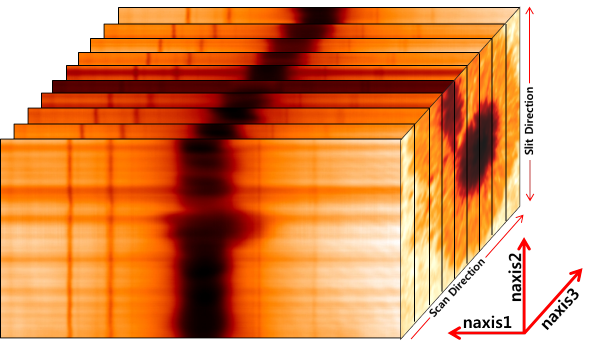
FISS is an imaging spectroscopy instruments. It means the data obtained by FISS have basically two information : spectral and spatial information. Furthermore, the data have an additional information, the time. Schematic structure of FISS data are follows:

The data format of FISS is FITS. FITS format consist two contents, data header and data itself. When we take data from FISS, basic information about observation is written in FITs header. After calibration process, additional information is added in FITs file. This is important list of FITs header in FISS data.
Contents of FITs Header in FISS data
| Contents | Values | Description |
|---|---|---|
| NAXIS | 3 | The number of axis |
| NAXIS1 | 512(A) or 502(B) | The number of x-axis (spectral direction) |
| NAXIS2 | 256(A) or 500(B) | The number of y-axis (Spatial direction along slit direction) |
| NAXIS3 | ex)200 | The number of z-axis (Number of frame per a scan) |
| DATE | YYYY-MM-DDTHH:MM:SS.SSS | The time of data construction |
| HBINNING | 1 | Horizontal Binning Rate of CCD |
| VBINNING | 2 | Vertical Binning Rate of CCD |
| STRTIME | YYYY-MM-DDTHH:MM:SS.SSS | Start time to scan |
| ENDTIME | YYYY-MM-DDTHH:MM:SS.SSS | Finish time to scan |
| ELAPTIME | ex)33.45 | Time difference between ENDTIME and STRTIME(Second) |
| FISSMODE | Spectrograph or Imaging | FISS operation mode |
| STEPTIME | ex)130 | The time(ms) to take 1 step(ccd exp. time + scan. moving time) |
| STEPSIZE | ex)32 | The distance bwtween neighboring steps (um) |
| CCDTEMP | ex)-30 | Cooling Temperature of CCD (degree celsius) |
| WAVELEN | 6562.8(A) or 8542(B) | Wavelength(angstrom) |
| OBSERVER | ex)Jongchul Chae | The observer who use FISS |
| TARGET | ex)Sunspot_01 | Observation Target |
| TEL_XPOS | ex)-341 | Solar Coordination of X-direction (arcsec) |
| TEL_YPOS | ex)247 | Solar Coordination of Y-direction (arcsec) |
| CRPIX1 | ex)257.94 | Pixel position of reference line center |
| CDELT1 | 0.019..(A) or -0.025..(B) | Wavelength range per pixel : dispersion(angstrom) |
| CRVAL1 | 6562.817(A) or 8542.09(B) | Wavelength at reference line center |
Because FISS can record dual band data, we have two files, Hα and CaII 8542. Then we add the form of "_A" or "_B" in the filename. "A" and "B" mean Hα, CaII data or Na, Fe data, respectively. We use time information as FISS filename. There are six kinds of filename forms.
- FISS_YYYYMMDD_HHMMSS.SSS_A(B).fts - Raw Data
- FISS_YYYYMMDD_HHMMSS.SSS_A1(B1).fts - Processed Data
- FISS_YYYYMMDD_HHMMSS.SSS_A1(B1)_c.fts - Compression Data from processed data
- FISS_YYYYMMDD_HHMMSS.SSS_A1(B1)_p.fts - Support data to construct compression data
- FISS_YYYYMMDD_HHMMSS.SSS_A(B)_BiasDark.fts - Dark data
- FISS_YYYYMMDD_HHMMSS.SSS_A(B)_Flat.fts - Flat/Calibration data
The filename is determined by Universal Time (UT). This means YYYY of year, MM of month, DD of day, HH of hour, MM of minute, SS.SSS of second, respectively. If you try to read FITs file of FISS, you can read readfits.pro in IDL. In case of compression files, however, you cannot read FISS data completely. Of course, you can use readfits.pro to FISS data but the information from readfits function is meaningless. A Compression file consists of two files, "_c.fts" and "_p.fts". If you want to compression, "c" and "p" files should be located same directory. More description about processed and compression file are shown by calibration process.
Calibration Process
If you use processed data or compression data, it's OK to skip this page.
The FISS instrument provide us three kinds of data : Raw(Science) Data, Flat/Calibration data and dark data. The main parameters for science data are listed in the page, Data Structure.
Data Calibration
When we observe the Sun, FISS produce two kinds of raw data corresponding to wavelengths Hα and CaII. But these cannot be used directly for scientific research. we pre-process the raw data using the following methods:
Bias and Dark Correction
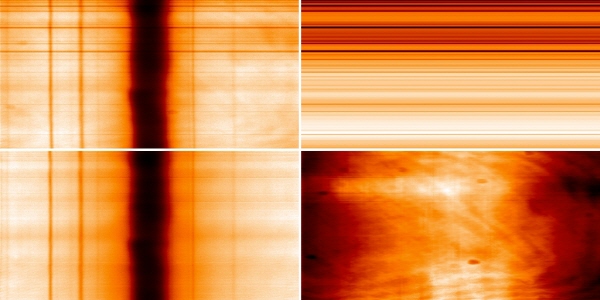
When we observe the Sun, we set observation conditions on control program like exposure time, cooling temperature, number of frame and so on. If we set the observation condition, mechanical shutter on CCD is open. Before starting the observation, CCD take a data with shutter off under same condition. This is dark data. Bias is the value greater than 0 with no exposure time. It is also known that dark current is proportional to time with constant temperature. Because raw and dark data have same bias level and same dark noise, we just subtract bias/dark from raw data using dark data.
Flat Correction
One of the most difficult problem is to get the flat pattern. In contrary to imaging data, we should consider wavelength variation. When we observe the Sun, we put the telescope to a quiet area of solar disk. We obtain the data in quiet region with field scanning and averaged one. This process repeat 7 times with changing grating angle. We search for this data and find variation of wavelength on spectrograms. With the use of Chae's IDL code to make flat fielding, we can get flat-fielding data and correct raw data.
Slit Pattern Correction
The slit width of FISS is 32μm, which corresponds to 0.16" on the Sun and two pixels on CCD chip. If slit width is constant along two blades, light level should be uniform alog slit direction. In real observation, however, light strength is not constant along slit because of machine accuracy and dust between blades. This non-uniform pattern affect variation of light level in veritcal direction on a spectrogram. In case of dust, it makes horizontal lines in spectral direction. Then we search the intensity variation with slit position and remove the slit pattern.
Wavelength Calibration
FISS data consists of several hundreds of spectrograms. For scientific research, wavelength calibration is most important. There are many absorption lines not only at Hα but also at CaII. With the use of spectrum atlas, we can identify each lines. Based on telluric lines from the Earth atmosphere or metal lines from solar photosphere, we decide wavelength precisely. By using these lines, we can calculate the position of line center at Hα and CaII, the wavelength per a pixel and wavelength coverage on the data.

PCA Compression
Since the size of processed data is so large, we try to compress them without loss of information using Principal Component Analysis(PCA) in IDL. In addition, PCA compression give us the data with less noise.